> ## Documentation Index
> Fetch the complete documentation index at: https://docs.gegentic.com/llms.txt
> Use this file to discover all available pages before exploring further.
# Observability
> A single project Dashboard covering usage, cost, and governance posture, alongside the Audit Log, Violations, and Review Queue.
Gaining visibility into your AI agents' behavior means tracking cost, latency, errors, and policy compliance in one place. Gegentica's Dashboard brings all of this together for a project, with governance-specific views to drill into violations and human review decisions.
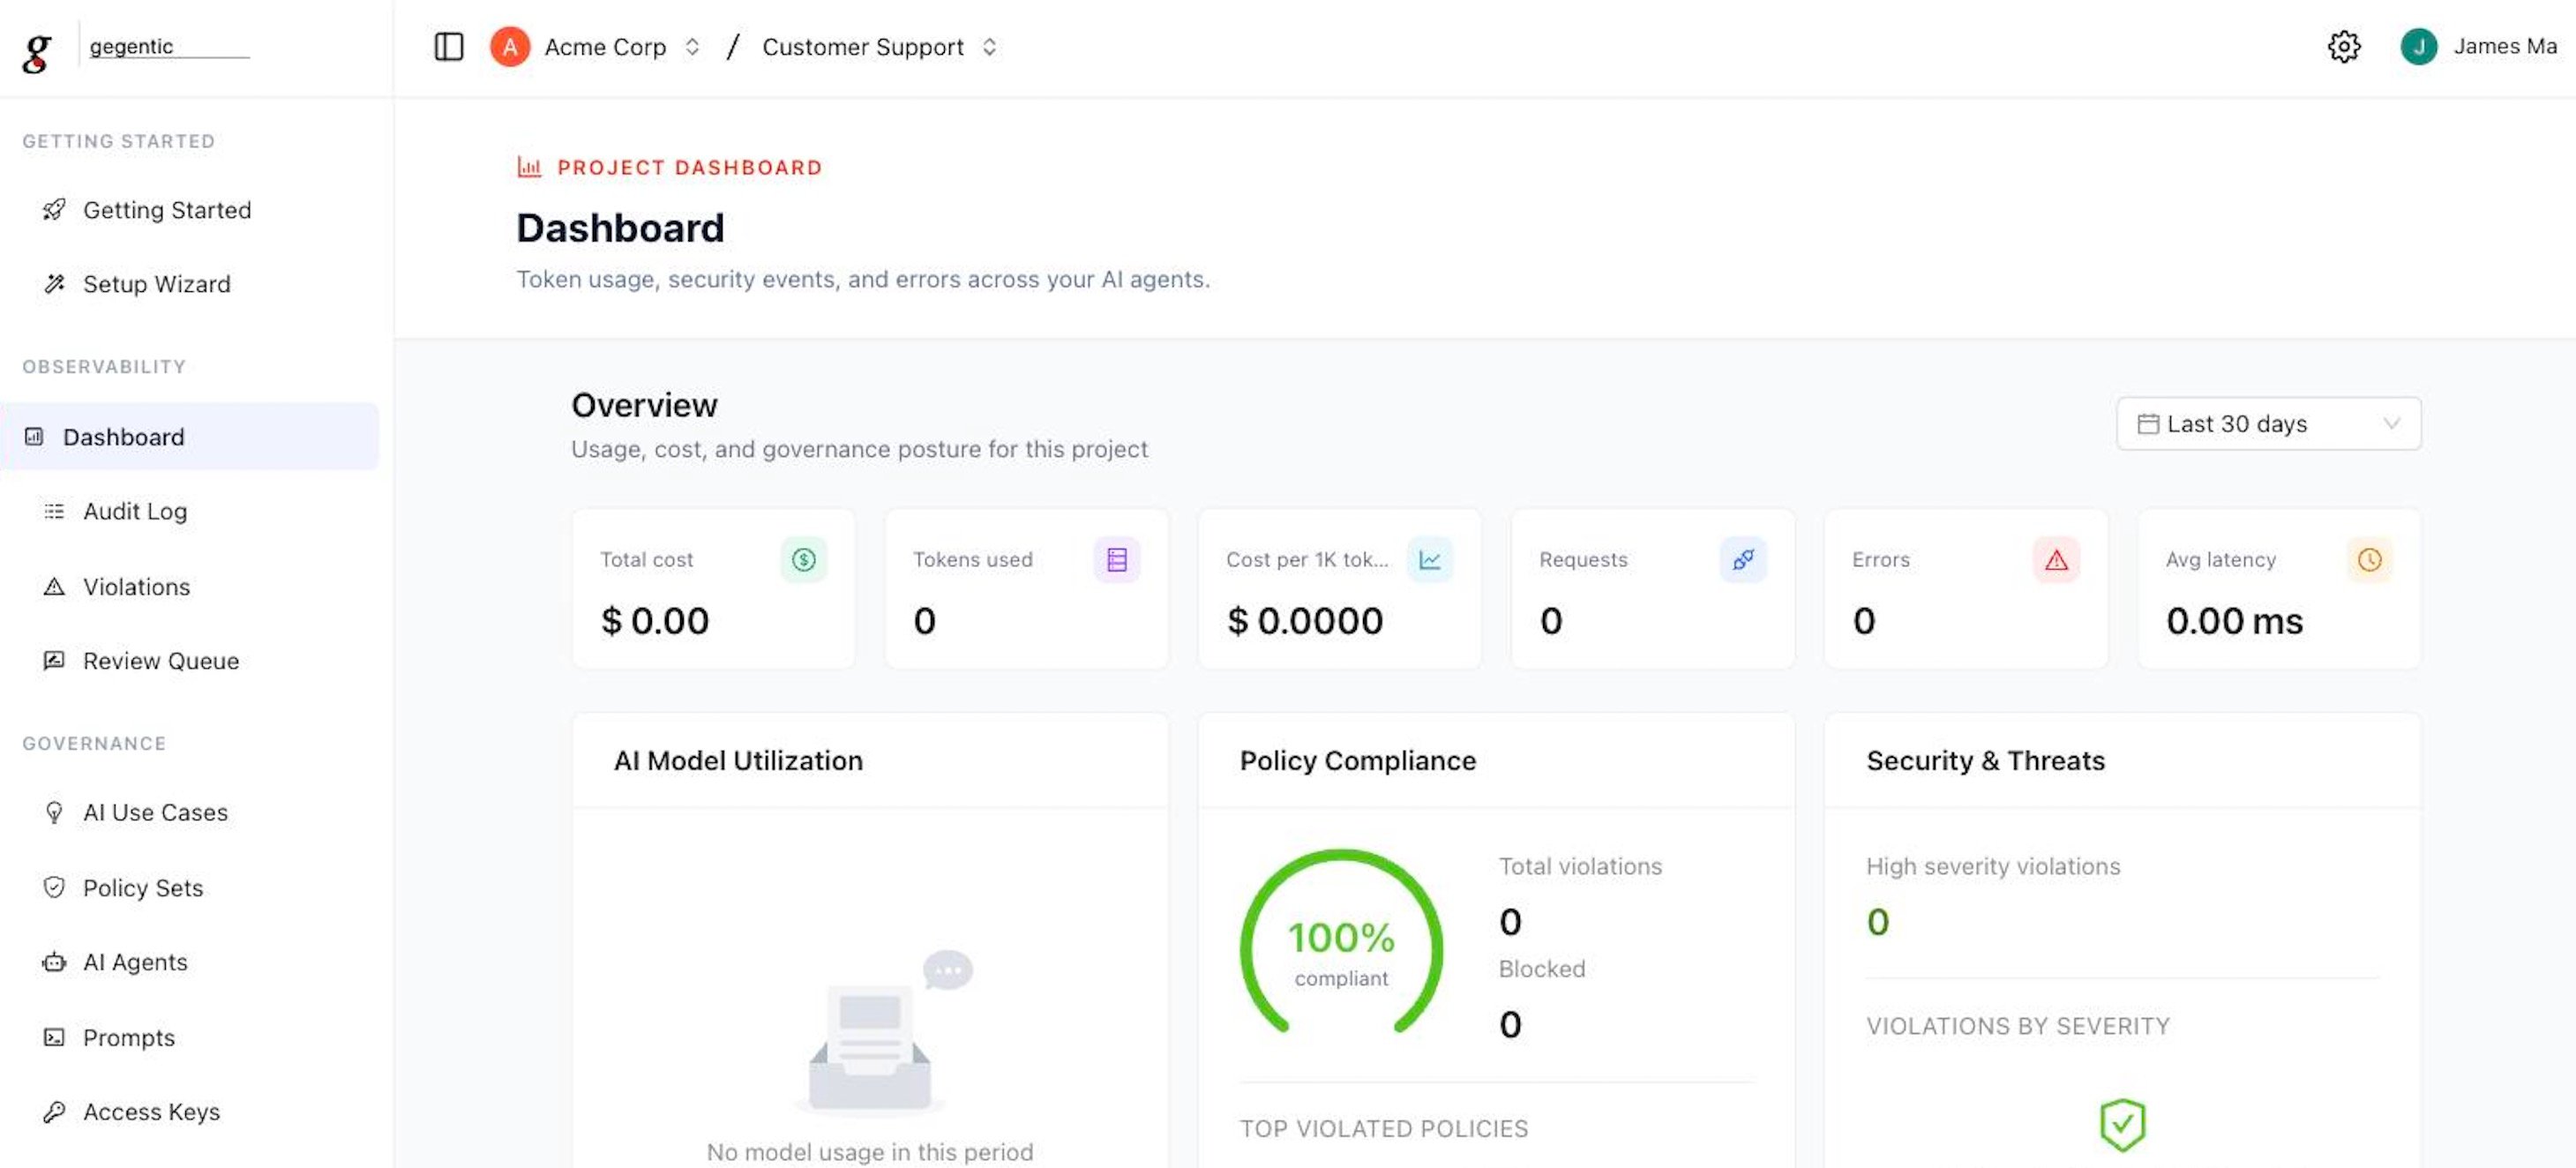 ## What's on the Dashboard
* **Overview stats** — Total cost, Tokens used, Cost per 1K tokens, Requests, Errors, and Avg latency over a selectable time range (default: last 30 days)
* **AI Model Utilization** — which models your agents are calling and how often
* **Policy Compliance** — a compliance percentage, total violations, blocked count, and the top violated Policy Sets
* **Security & Threats** — high-severity violation count, broken down by severity
* **Most Active Projects** — request volume by project, for orgs with multiple projects
## Features
A time-ordered, exportable record of governance events at the project and organization level.
AI agent outputs held for mandatory human review before being released.
Daily automated evaluation of AI agent outputs for bias, fairness, and ethical compliance.
## What's on the Dashboard
* **Overview stats** — Total cost, Tokens used, Cost per 1K tokens, Requests, Errors, and Avg latency over a selectable time range (default: last 30 days)
* **AI Model Utilization** — which models your agents are calling and how often
* **Policy Compliance** — a compliance percentage, total violations, blocked count, and the top violated Policy Sets
* **Security & Threats** — high-severity violation count, broken down by severity
* **Most Active Projects** — request volume by project, for orgs with multiple projects
## Features
A time-ordered, exportable record of governance events at the project and organization level.
AI agent outputs held for mandatory human review before being released.
Daily automated evaluation of AI agent outputs for bias, fairness, and ethical compliance.