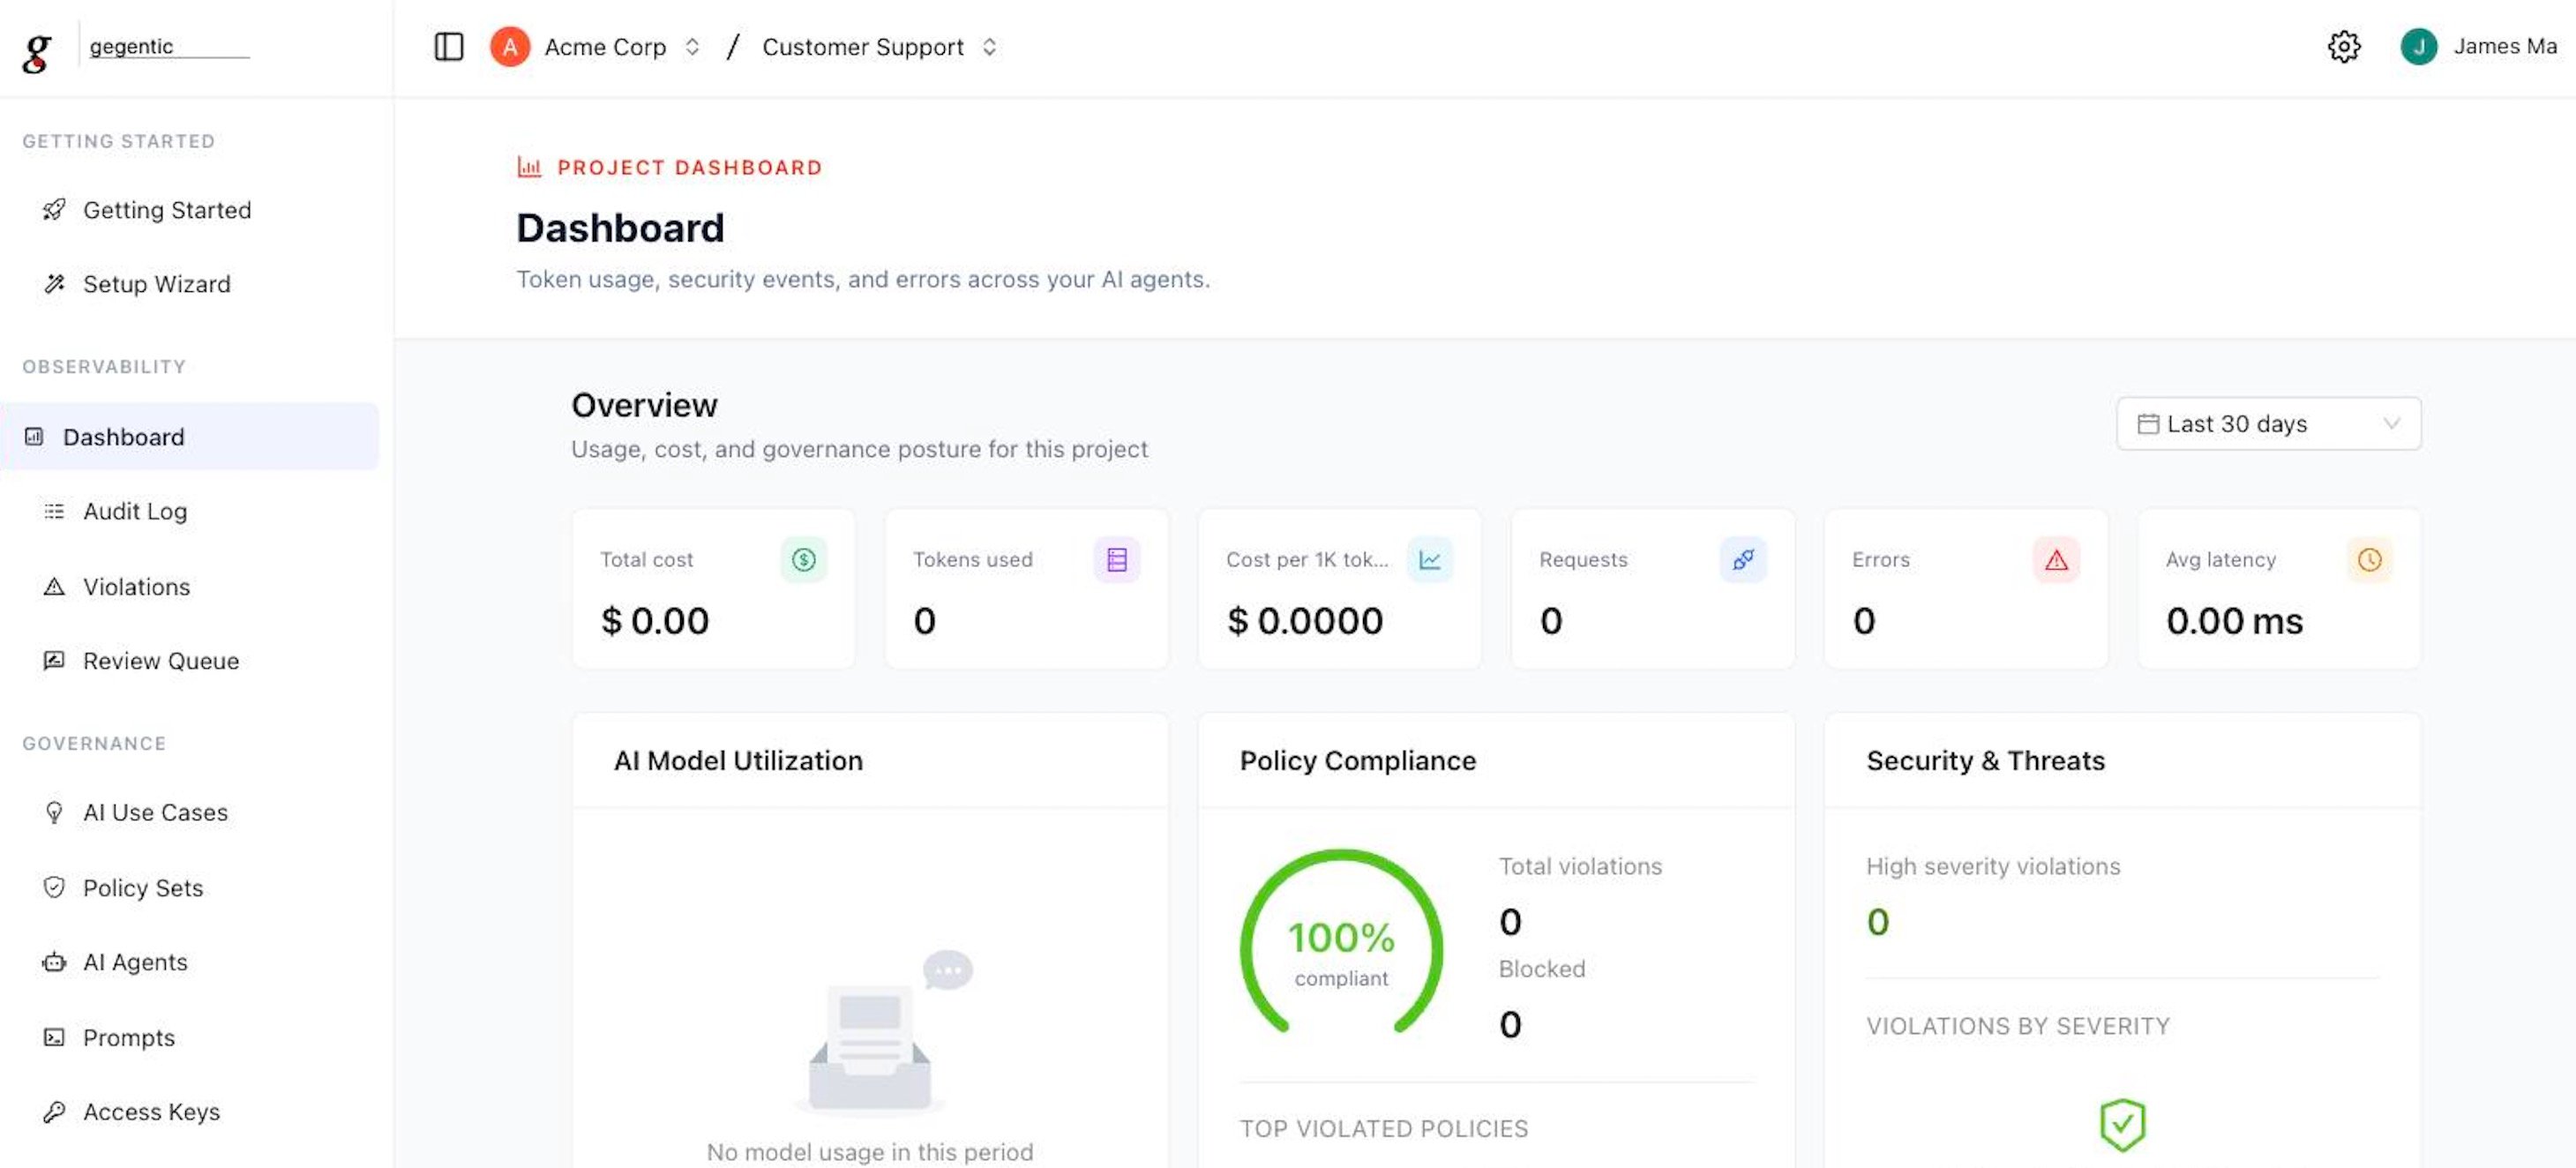
The project Dashboard — usage, cost, and governance posture in one view
What’s on the Dashboard
- Overview stats — Total cost, Tokens used, Cost per 1K tokens, Requests, Errors, and Avg latency over a selectable time range (default: last 30 days)
- AI Model Utilization — which models your agents are calling and how often
- Policy Compliance — a compliance percentage, total violations, blocked count, and the top violated Policy Sets
- Security & Threats — high-severity violation count, broken down by severity
- Most Active Projects — request volume by project, for orgs with multiple projects
Features
Audit Log
A time-ordered, exportable record of governance events at the project and organization level.
Review Queue
AI agent outputs held for mandatory human review before being released.
Ethics & Bias
Daily automated evaluation of AI agent outputs for bias, fairness, and ethical compliance.